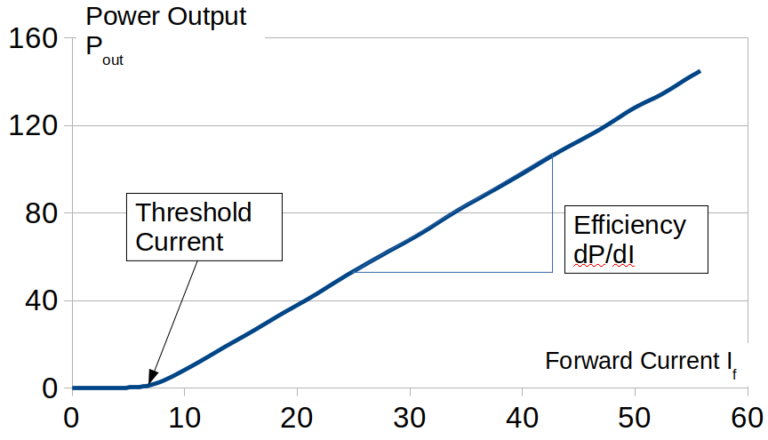
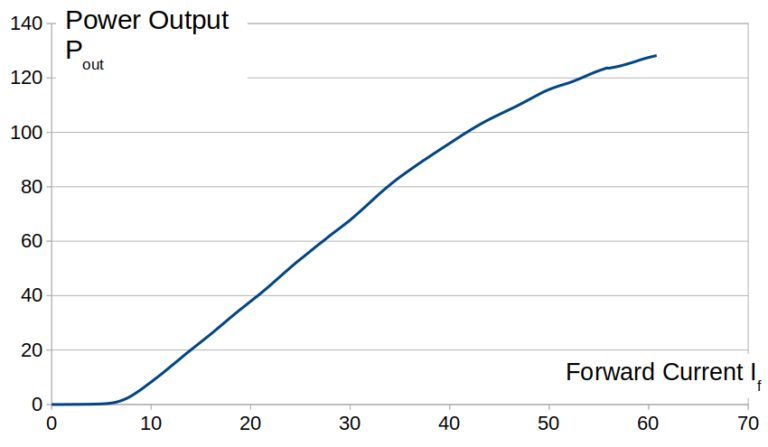
The P/I curve depicts the laser output power as a function of the forward current. Since this literally is what lasers are intended to do, this measurement is always performed.
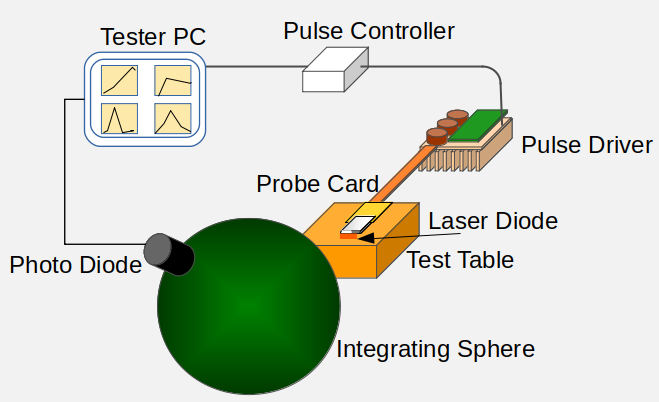
For vertical emitters, the laser diodes can rest on the tape and be measured from the top. Edge emitters need to be picked up and placed on a chuck so that the the emitting surface is facing the sensor. Depending on the contacts location on the diode, pins are used together with the chuck as electrodes to impinge the current on the laser diode. Some laser diodes use the substrate as an n-contact, while others have both contacts on the top side.
Special attention must be placed on the current source to avoid current peaks. The wire length from the power source to the laser diode can be restricted in the case of very short pulsed measurements. On the sensor side a simple semiconductor photodiode is normally both practical and inexpensive. Up to ~1100nm silicon is used, while up to 1800nm InGaAs is preferred. The laser radiation can be collected with collimating optics but it is much easier to just use an integrating sphere with a large aperture. Sometimes, a large area photodetector can be used as well to collect the laser radiation. The photodetector either in the integrating sphere or as direct detector will provide a photo-current that must be transformed into a voltage for the sensitive measurement equipment. The wavelength dependency of the photodetector sensitivity must be taken into account when interpreting the results.
In an full automatic testing tool a very large number of devices can be characterized in minimum time while providing a high degree of repeatability of the results.
The actual characterization melts down to few figures that are compared from device to device. Main takeaways from a P/ I curve are the threshold current and the efficiency.
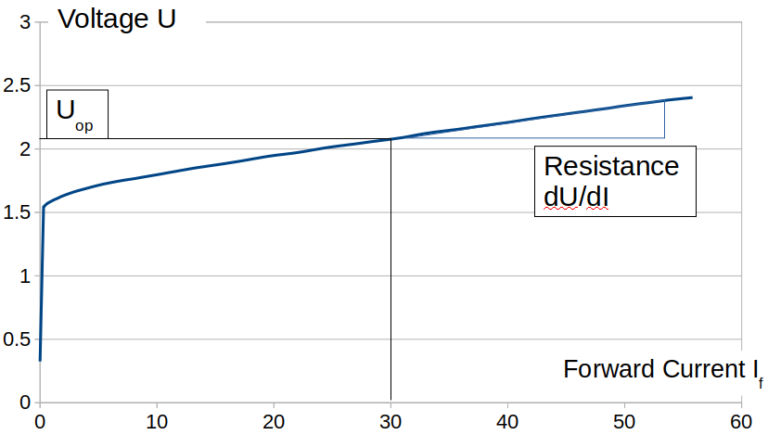
The PI measurement is usually done in parallel with the voltage-current measurement, which is very easy to implement. The main purpose of the IV measurement is to detect electrical irregularities such as high series or contact resistance. The operating voltage at a predefined current and the series resistance are usually the numerical takeaways.
The U/I curve with the operating voltage a certain operating forward current and the calculated resistance out of the differential U/I.
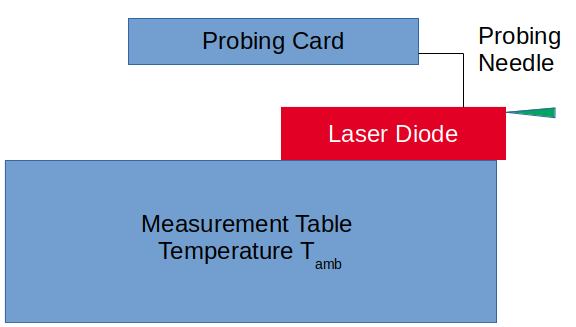
The laser diode temperature plays an important role in the measurement of the P/I curve. A Peltier element that is thermally attached to the table holding the laser diode is normally the easiest way to adjust the laser ambient temperature to ~1K. This makes measurements independent of ambient temperature and allows to implement a large range of measurement temperatures.
The laser diode temperature must be carefully monitored to make measurements comparable from batch to batch and in some cases to compare measurements taken at different temperatures.
Yet the actual temperature in the diode itself is the junction temperature Tj, which is higher than the ambient temperature due to the loss mechanisms in the semiconductor. In order to keep Tj as close as possible to the ambient temperature the measurement length is kept as short as possible. The full current should only be applied for the shortest time possible in order to not allow the semiconductor to heat itself up.
The temperature of the laser diode is higher as the table temperature. The loss mechanisms within the laser transform a considerable amount of the electric input energy into heat.
A higher junction temperature strongly lowers the slope efficiency of the laser diode. Since this mechanism reinforces itself in a positive feedback loop, the laser radiation goes down despite a further increase in the forward current, leading to a visible rollover in the PI curve.
When this effect is observed, the measured parameters need to be reconsidered. Obviously one solution is to reduce the maximum current. Sometimes another solution is feasible: To reduce the pulse width of the measurement. Even while keeping a high pulse amplitude, a very short pulse will allow time for the laser heat to dissipate and keep Tj close to Tambient.
If very high pulses and low pulse width have to be realized, a more elaborate laser driver, a shorter wiring length to contact the laser diode and a faster and more sensitive sensor might be required. On the other side, a setup that enables short pulse width places a much lower thermal load on the bare laser diodes, preventing thermal damage too. Also the risk of eye injury is lowered when the pulse width is shortened.
This P/I curve shows a typical case of thermal rollover at higher currents.
We value your feedback, so let us know what you think!
Let us also know which topics you would like to see expanded.
Just give us a call, send us an e-mail or use the form to contact us.